 3dep-lidar-copc

# 概述
此集合包含来自USGS 3DEP 程序 (opens new window)的源数据,这些数据重新格式化为COPC (opens new window)格式。COPC 文件是一个 LAZ 1.4 文件,用于存储以集群八叉树组织的点数据。它包含一个 VLR,描述了存储在 LAZ 1.4 块中的数据的八叉树组织。最终产品是 LAZ 到 UTM 重新投影的 COPC 文件的一对一映射。
LAZ 数据是以压缩的LASzip (opens new window)格式存储的地理空间LiDAR 点云 (opens new window)(LPC) 内容。数据被重组并存储在与 LAZ 兼容的COPC (opens new window)组织中,用于支持增量空间访问和云流的行星计算机。
LPC 可以概括为构建数字地形模型 (DTM),过滤以提取植被和建筑物等特征,并可视化以提供与激光扫描仪交互的物理空间的点云图。来自 3DEP 的 LPC 内容用于计算和提取各种景观特征产品,其中一些由 Planetary Computer 提供,包括地表高度、相对强度图像以及 DTM 和数字表面模型。
LAZ 瓦片代表USGS 3DEP 程序 (opens new window)提供的原始瓦片内容的一对一映射,不同之处在于数据被重新投影并标准化为适合其位置的 UTM 区域,而无需调整垂直基准面。在某些情况下,垂直基准面描述可能与实际数据值不匹配,尤其是 2010 年之前的 USGS 3DEP 点云数据。
除了这些 COPC 文件之外,各种更高级别的衍生产品在其他集合 (opens new window)中作为云优化 GeoTIFF 提供。
# STAC 集合
https://planetarycomputer-staging.microsoft.com/api/stac/v1/collections/3dep-lidar-copc
# 提供者
Landrush(processor, producer)USGS (opens new window)(processor, producer, licensor)Microsoft (opens new window)(host, processor)
# License
USGS (United States Geological Survey) License (opens new window)
# 空间范围
# 时间范围
01/01/2012 – 01/01/2022
# GSD
2 m
# 项目级资产
数据集项目包含以下资产。
| Title | STAC Key | Roles | Type | Type | Format |
|---|---|---|---|---|---|
| COPC data | data | Data | Application/vnd.laszip+copc | lidar | application/vnd.laszip+copc |
| 3DEP Lidar COPC | thumbnail | Thumbnail | PNG image | – | – |
# 使用 Planetary Computer STAC API 访问 3DEP 激光雷达 COG 数据
Planetary Computer包括一组源自 USGS 3DEP 激光雷达计划的数据集。原始数据可作为 COPC 资产的集合获得。此外,还提供各种衍生产品,例如 Intensity (opens new window)和Height Above Ground (opens new window) 。
此笔记本演示如何使用派生的 COG 产品。有关使用 COPC 数据的更多信息,请参阅其示例笔记本 (opens new window)。
# 环境设置
此笔记本可使用或不使用 API 密钥,但您将获得使用 API 密钥访问数据的更多权限。 Planetary Computer Hub (opens new window) 已预先配置为使用您的 API 密钥。
import pystac_client
import planetary_computer
import rasterio
import numpy as np
import matplotlib
import matplotlib.pyplot as plt


# Set the environment variable PC_SDK_SUBSCRIPTION_KEY, or set it here.
# The Hub sets PC_SDK_SUBSCRIPTION_KEY automatically.
# pc.settings.set_subscription_key(<YOUR API Key>)

client = pystac_client.Client.open(
    "https://planetarycomputer-staging.microsoft.com/api/stac/v1/"
)
我们将使用 STAC API 从华盛顿特区的这些不同集合中搜索项目。
collections = [
    "3dep-lidar-hag",
    "3dep-lidar-dsm",
    "3dep-lidar-pointsourceid",
    "3dep-lidar-intensity",
    "3dep-lidar-dtm",
    "3dep-lidar-dtm-native",
    "3dep-lidar-returns",
    "3dep-lidar-classification",
]

search = client.search(
    collections=collections,
    intersects={
        "type": "Point",
        "coordinates": [-77.10058811018344, 38.838335717896314],
    },
    datetime="2018",
)
items = planetary_computer.sign(search.get_all_items())
items = {x.collection_id: x for x in items}

items
输出:
{'3dep-lidar-returns': <Item id=USGS_LPC_VA_Fairfax_County_2018-returns-5m-2-1>,
 '3dep-lidar-pointsourceid': <Item id=USGS_LPC_VA_Fairfax_County_2018-pointsourceid-5m-2-1>,
 '3dep-lidar-intensity': <Item id=USGS_LPC_VA_Fairfax_County_2018-intensity-2m-5-3>,
 '3dep-lidar-hag': <Item id=USGS_LPC_VA_Fairfax_County_2018-hag-2m-5-3>,
 '3dep-lidar-dtm-native': <Item id=USGS_LPC_VA_Fairfax_County_2018-dtm_native-2m-5-3>,
 '3dep-lidar-dtm': <Item id=USGS_LPC_VA_Fairfax_County_2018-dtm-2m-5-3>,
 '3dep-lidar-dsm': <Item id=USGS_LPC_VA_Fairfax_County_2018-dsm-2m-5-3>,
 '3dep-lidar-classification': <Item id=USGS_LPC_VA_Fairfax_County_2018-classification-5m-2-1>}
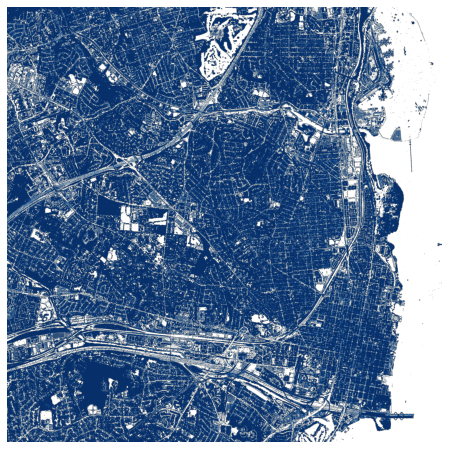
# 离地高度
此 COG 类型是使用 COPC (opens new window) 数据数据的 Z 维度生成的,并使用pdal.filters.smrf (opens new window) 与 pdal.filters.hag_nn (opens new window)来去除噪声、水。
ds = rasterio.open(items["3dep-lidar-hag"].assets["data"].href).read().squeeze()
这个 COG 有一个特殊的颜色图,我们可以使用它来正确地可视化它的值。
pairs = [
    ((-900, 1), (0, 0, 0, 0)),
    ((1, 2), (205, 224, 241, 255)),
    ((2, 3), (175, 209, 231, 255)),
    ((3, 4), (137, 190, 220, 255)),
    ((4, 5), (96, 166, 210, 255)),
    ((5, 6), (34, 114, 181, 255)),
    ((6, 7), (10, 84, 158, 255)),
    ((7, 100), (8, 48, 107, 255)),
]


intervals, colors = zip(*pairs)
nodes = np.array([x[1] for x in intervals]).astype(float)
nodes -= np.abs(nodes.min())
nodes /= nodes.max()


colors = [np.asarray(c) / 255 for c in colors]

cmap = matplotlib.colors.LinearSegmentedColormap.from_list(
    "hag", list(zip(nodes, colors))
)
fig, ax = plt.subplots(figsize=(8, 8))

ax.imshow(cmap(ds), cmap=cmap)
ax.set_axis_off()
# 强度
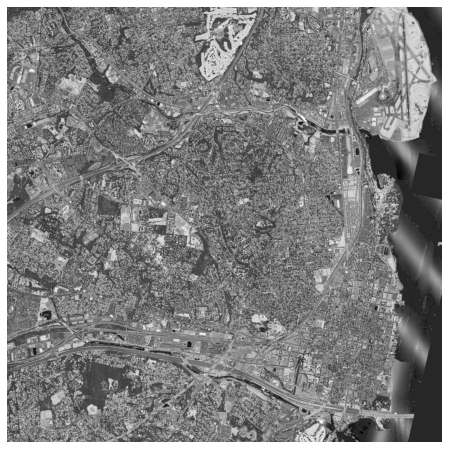
此集合源自 USGS 3DEP COPC 集合。它是代表脉冲返回幅度的云优化 GeoTIFF 的集合。
ds = rasterio.open(items["3dep-lidar-intensity"].assets["data"].href).read().squeeze()

fig, ax = plt.subplots(figsize=(8, 8))

ax.imshow(ds, cmap="gray")
ax.set_axis_off()
# 返回
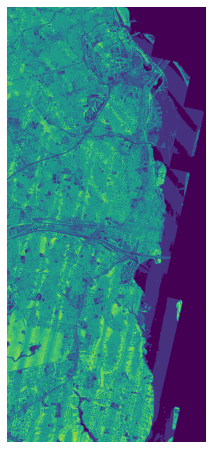
此集合源自 USGS 3DEP COPC collection (opens new window) 集合。它是云优化 GeoTIFF 的集合,表示给定脉冲的返回次数。
ds = rasterio.open(items["3dep-lidar-returns"].assets["data"].href).read().squeeze()
np.putmask(ds, ds < 1, 0)
np.putmask(ds, ds >= 7, 7)

fig, ax = plt.subplots(figsize=(8, 8))

ax.imshow(ds)
ax.set_axis_off()
# 分类
此集合源自 USGS 3DEP COPC collection (opens new window) 集合。它使用 ASPRS (opens new window)(美国摄影测量与遥感协会) 激光点云分类 (opens new window)。有关详细信息,请参阅 LAS (opens new window) 规范。
ds = (
    rasterio.open(items["3dep-lidar-classification"].assets["data"].href)
    .read()
    .squeeze()
)
ds = np.where(ds > 0, ds, np.nan)
fig, ax = plt.subplots(figsize=(8, 8))

ax.imshow(ds, cmap="tab20")
ax.set_axis_off()

# DSM
此集合源自USGS 3DEP COPC collection (opens new window)集合。它使用 pdal.filters.range (opens new window) 创建一个数字表面模型 (DSM),以输出云优化的 GeoTIFF 集合,去除所有被分类为噪声的点。
ds = rasterio.open(items["3dep-lidar-dsm"].assets["data"].href).read().squeeze()
ds = np.where(ds > 0, ds, np.nan)
fig, ax = plt.subplots(figsize=(8, 8))

ax.imshow(ds, cmap="gray")
ax.set_axis_off()

# DTM
此集合源自 USGS 3DEP COPC collection (opens new window) 集合。它使用 pdal.filters.smrf (opens new window) 创建数字地形模型 (DTM) 以输出云优化 GeoTIFF 的集合。
ds = rasterio.open(items["3dep-lidar-dtm"].assets["data"].href).read().squeeze()
ds = np.where(ds > 0, ds, np.nan)
fig, ax = plt.subplots(figsize=(8, 8))

ax.imshow(ds, cmap="gray")
ax.set_axis_off()

# DTM Native
此集合源自 USGS 3DEP COPC collection (opens new window)集合。它使用供应商提供的(本地)地面分类和 pdal.filters.range (opens new window)创建数字地形模型 (DTM),以输出云优化 GeoTIFF 的集合,删除所有已分类为噪声的点。
ds = rasterio.open(items["3dep-lidar-dtm-native"].assets["data"].href).read().squeeze()
ds = np.where(ds > 0, ds, np.nan)
fig, ax = plt.subplots(figsize=(8, 8))

ax.imshow(ds, cmap="gray")
ax.set_axis_off()

# 点源 ID
此集合源自 USGS 3DEP COPC 集合。它是云优化 GeoTIFF 的集合,表示该点源自的文件源 ID。零表示该点起源于当前文件。
ds = (
    rasterio.open(items["3dep-lidar-pointsourceid"].assets["data"].href)
    .read()
    .squeeze()
)
ds = np.where(ds > 0, ds, np.nan)
fig, ax = plt.subplots(figsize=(8, 8))

ax.imshow(ds, cmap="tab20")
ax.set_axis_off()

# 使用 PDAL、STAC 和行星计算机处理 COPC 数据
此方案演示如何使用 PDAL Python 绑定从 COPC 文件生成一些简单的栅格产品。
# COPC
COPC 是云优化点云。 COPC 文件是 LASzip LAZ 1.4 数据,以集群八叉树的形式存储。 COPC 文件允许应用程序为窗口或分辨率选择数据,并允许它们限制必须获取、解压缩和处理的数据量。您可以在 https://lidarmag.com/2021/12/27/cloud-native-geospatial-lidar-with-the-cloud-optimized-point-cloud/ 阅读有关 COPC 的更多信息
# PDAL
PDAL 支持通过 reader.copc 和 writers.copc 读取和写入 COPC。
# PDAL-Python
PDAL Python 绑定允许以编程方式组合 PDAL 管道。
# 我们在做什么?
- 使用 Planetary Computer 的 STAC API 从芝加哥选择一些数据
- 写一个相对强度图像(RII)
- 提取一个 HeightAboveGround 表面并估计场景中地面的最高点
# 设置
我们首先要定义一些导入和帮助代码。
导入
import pdal
import pystac_client
import planetary_computer
import PIL
import pyproj
用于估计点的 UTM 区域的有用代码
使用 PyPROJ的方法 (opens new window)估计点的 UTM 区域
# Estimate our UTM zone
from pyproj import CRS
from pyproj.aoi import AreaOfInterest
from pyproj.database import query_utm_crs_info


def get_utm(point):
    longitude, latitude = point.x, point.y
    buffer = 0.001
    utm_crs_list = query_utm_crs_info(
        datum_name="WGS 84",
        area_of_interest=AreaOfInterest(
            west_lon_degree=longitude - buffer,
            south_lat_degree=latitude - buffer,
            east_lon_degree=longitude + buffer,
            north_lat_degree=latitude + buffer,
        ),
    )
    utm_crs = CRS.from_epsg(utm_crs_list[0].code)
    return utm_crs
# 找出在哪里查询
- 为 Bean (opens new window)定义 GeoJSON 点几何
- 在 UTM 中缓冲 400m
- 将其重新投影回 EPSG:4326,以便我们可以使用它来查询 STAC AP
- 绘制它,让它看起来不错
# The Bean
bean = {"type": "Point", "coordinates": [-87.623358, 41.8826812]}

from shapely.geometry import shape
from shapely.ops import transform

geom = shape(bean)

utm = get_utm(geom)

wgs84 = pyproj.CRS("EPSG:4326")

project_dd_to_utm = pyproj.Transformer.from_crs(wgs84, utm, always_xy=True).transform
project_utm_to_dd = pyproj.Transformer.from_crs(utm, wgs84, always_xy=True).transform

utm_point = transform(project_dd_to_utm, geom)
window = utm_point.buffer(400)

window_dd = transform(project_utm_to_dd, window)

import geopandas

df = geopandas.GeoDataFrame(geometry=[window_dd], crs="EPSG:4326")

df.explore()
# 查询行星计算机 STAC API
- 查询 3dep-lidar-copc 集合的 STAC API与我们以千禧公园的豆子为中心的缓冲多边形相交
- 过滤响应以确保 ID 中包含“Cook”,该 ID 用于伊利诺伊州库克县
- 使用 Planetary Computer 的代币签署回复
catalog = pystac_client.Client.open(
    "https://planetarycomputer-staging.microsoft.com/api/stac/v1"
)

search = catalog.search(collections=["3dep-lidar-copc"], intersects=window_dd)
ic = search.get_all_items()
signed = planetary_computer.sign(ic)
定义一些我们将用于查询的变量
OUTPUT_RESOLUTION = 2.0
READ_RESOLUTION = 2.0
polygon = window.wkt + f" / EPSG:{utm.to_epsg()}"
# 使用 reader.copc 为每个图块定义一个 PDAL 阅读器
url是一个签名的、支持 HTTP 的 URL,我们可以从中读取requests是要使用的线程数。我们需要使用比默认的 15 小得多的数字resolution是数据的下限分辨率。分辨率并不准确,它取决于构建 COPC 文件时八叉树的结构和断点。将其设置为一个值意味着返回的点至少满足该分辨率polygon是一个 WKT 或 GeoJSON 几何图形,它既可以预先过滤从 COPC 文件中选择的数据,又可以在读取数据时对其进行剪辑。
readers = []
for tile in signed:
    url = tile.assets["data"].href
    reader = pdal.Reader.copc(
        url, requests=3, resolution=READ_RESOLUTION, polygon=polygon
    )
    readers.append(reader)
# 对强度应用缩放
LAS 规范要求强度和 RGB 值在 16 位范围内,但我们将制作一些 8 位 PNG。当我们从 PDAL 读取数据时,我们希望将这些值除以 256 以使它们进入 8 位范围。 PDAL 的 filters.assign 过滤器可用于在使用表达式处理点的值时对其进行操作。
assign = pdal.Filter.assign(value=["Intensity = Intensity / 256"])
# 定义 writer
writers.gdal (opens new window) 是栅格化点云数据的主力编写器,在这种情况下,我们将使用它编写一些 TIF。
resolution定义栅格的分辨率。这与我们用来读取 COPC 文件的内容无关,但您通常需要等于或等于读取分辨率的内容,这样您就不会在输出中引入伪影。dimension告诉writer要读取的点云维度。作者可用的维度取决于读者提供的内容。output_type告诉writer在数据中写入哪个波段。有关这方面的更多信息,请参阅 writers.gdal 文档nodata设置表示栅格的 nodata 的值
writer = pdal.Writer.gdal(
    "intensity.tif",
    resolution=OUTPUT_RESOLUTION,
    dimension="Intensity",
    data_type="uint8",
    output_type="mean",
)
# 构建管道
管道是处理数据的 PDAL 实体。虽然它们通常由 JSON 定义(尝试打印 pipeline.pipeline)并通过 pdal 管道命令进行处理,但它们也可以使用 PDAL Python 绑定通过 Python 以编程方式构建或组合。
pipeline = None

# Gather up all of our readers and concatenate them together
for reader in readers:
    if not pipeline:
        pipeline = reader
    else:
        pipeline = pipeline | reader

pipeline = pipeline | assign | writer
# 执行管道
执行管道,以便我们可以对结果做一些事情。在我们的场景中,结果将是由 writers.gdal 编写的 TIF 文件。它们也可能是我们可以检查点值或过滤器或其他任何东西的 Numpy 数组。
%%time

# Use streaming mode at 1e6 points at a time. This
# helps us conserve memory for pipelines that are streamable
# check that with the pipeline.streamable property
results = pipeline.execute_streaming(chunk_size=1000000)
print(pipeline.log)

# the last stage of our pipeline is the writer, and the 'dimension'
# option on the writer is what we want to print
dimension = pipeline.stages[-1].options["dimension"]
print(f"Number of points returned for dimension {dimension}: {results}")
Number of points returned for dimension Intensity: 1047992
CPU times: user 21.7 s, sys: 576 ms, total: 22.3 s
Wall time: 21.6 s
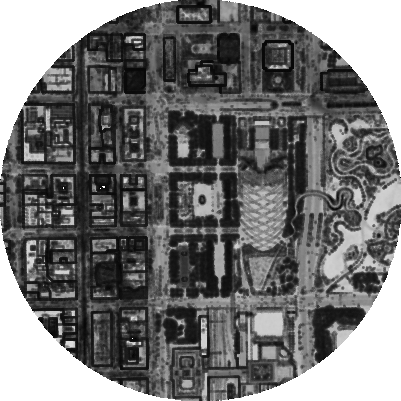
# 显示相对强度图像
PIL.Image.open("intensity.tif")
# 计算地表高度模型并确定最高点
# Gather up all of our readers and concatenate them together
pipeline = None

# Gather up all of our readers and concatenate them together
for reader in readers:
    if not pipeline:
        pipeline = reader
    else:
        pipeline = pipeline | reader

merge = pdal.Filter.merge()
hag = pdal.Filter.hag_nn()
writer = pdal.Writer.gdal(
    "hag.tif",
    resolution=OUTPUT_RESOLUTION,
    dimension="HeightAboveGround",
    data_type="float32",
    output_type="mean",
)


pipeline = pipeline | merge | hag | writer

p = pipeline.execute()
# 颜色渐变PNG
colorramp = """-10.18599987030029297,247,251,255,255,-10.1860
-0.00115290172120908,228,239,249,255,-0.0012
0.17222511302108146,209,226,243,255,0.1722
0.6745767967615599,186,214,235,255,0.6746
1.70373090991130027,154,200,224,255,1.7037
3.80649503742675499,115,178,216,255,3.8065
6.60277122391136828,82,157,204,255,6.6028
13.59346169012289351,53,133,191,255,13.5935
35.1501281897475053,29,108,177,255,35.1501
68.49649969184777376,8,81,156,255,68.4965
347.23944590611102967,8,48,107,255,347.2394"""
with open("hag-colors.txt", "w") as f:
    f.write(colorramp)
%%bash
gdaldem color-relief hag.tif hag-colors.txt hag.tif
0...10...20...30...40...50...60...70...80...90...100 - done.
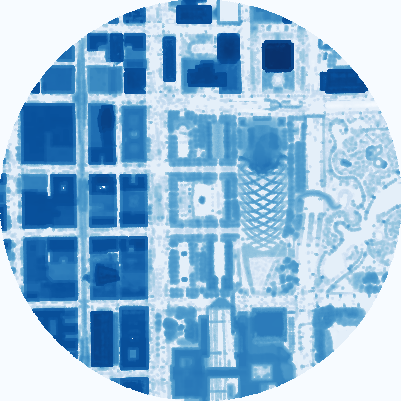
# 显示 HAG
PIL.Image.open("hag.tif")
# 显示有关 HAG 点的统计信息
import numpy

arr = pipeline.arrays[0]

print(arr)

# Note height is in meters
numpy.max(arr["HeightAboveGround"])
输出:
[(448433.62609864, 4637255.31905983, 372.27723393, 3390, 1, 1, 0, 0, 1, 15., 0, 0, 1.76456784e+08, 0, 0, 178.86)
 (448433.69609864, 4637255.22905983, 441.16723393,  491, 1, 1, 0, 0, 1, 15., 0, 0, 1.76456784e+08, 0, 0, 247.75)
 (448424.57609864, 4637255.18905983, 479.61723393,  673, 1, 1, 0, 0, 1, 15., 0, 0, 1.76456784e+08, 0, 0, 286.13)
 ...
 (448464.02609864, 4637236.15905983, 330.05723393,  283, 1, 1, 0, 0, 5, 15., 0, 0, 1.79808800e+08, 0, 0, 136.63)
 (448459.07609864, 4637253.67905983, 221.65723393, 1618, 1, 1, 0, 0, 5, 15., 0, 0, 1.79808800e+08, 0, 0,  28.23)
 (448464.63609864, 4637227.87905983, 197.45723393, 2836, 1, 1, 0, 0, 4, 15., 0, 0, 1.79808800e+08, 0, 0,   4.04)]

359.84000000000003

