 CHELSA气象数据
CHELSA (Climatologies at high resolution for the earth’s land surface areas)高分辨率陆地表层气候学数据,分辨率30弧秒,约1km,是由瑞士联邦森林雪景观研究所(Swiss Federal Institute for Forest, Snow and Landscape Research WSL)开发维护的全球降尺度气候数据。
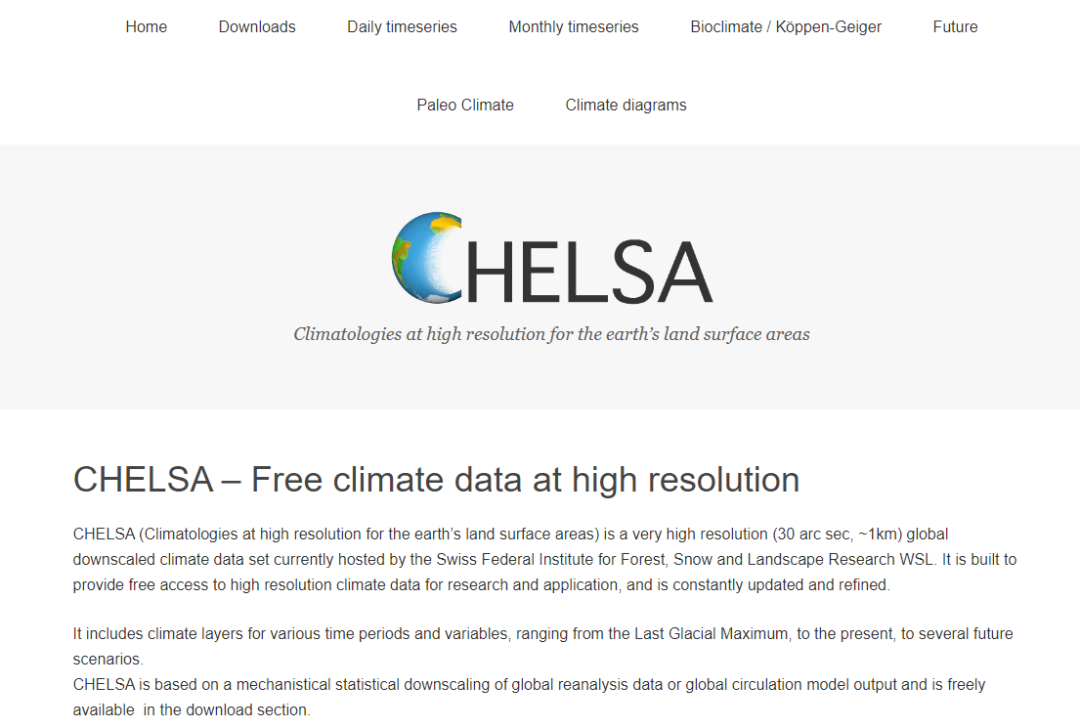 网站首页
网站首页
包含了众多的数据图层时间范围从末次盛冰期(the Last Glacial Maximum)至今,以及未来的几个场景。
# 和WorldClim、ERA5-LAND比较
# 优势
- 高分辨率,全球1km
- 包含一些特别的和植物生长有关的数据,例如gdd10数据为10℃以上的积温,这个积温数据我目前头一次见这种栅格的
# 劣势
- 和WordClim、ERA5-LAND数据相比,这套数据时间序列稍短一些,我大概看了一下月度数据,大部分从1981-2019年,没有ERA5-LAND更新快。
- 气候数据比如0度以上积温数据,是1981-2010年的多年均值,而不是时间序列,仅能反映空间分布趋势。

annual年度数据,climatologies气候数据是对应年份的均值,daily逐日,monthly逐月
# 数据下载
- 下载入口网址:https://chelsa-climate.org/downloads/
在这里提供了数据的下载入口,目前有两个版本的数据,2.1版和1.2版,两种数据都有数据文档,数据下载点击左侧小按钮,查看对应版本的数据技术文档点击右侧长按钮。
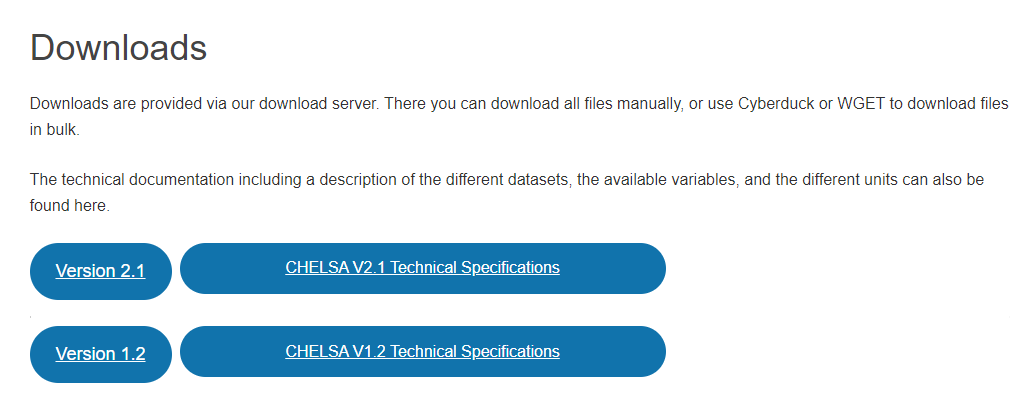 数据下载入口
# 下载方式
CHELSA数据提供了逐个下载,或者WGET批量下载的方式。
两种下载方法:
- 左侧选择所需的数据,单个手动下载
- 左侧批量选取数据,右侧获取WGET下载链接
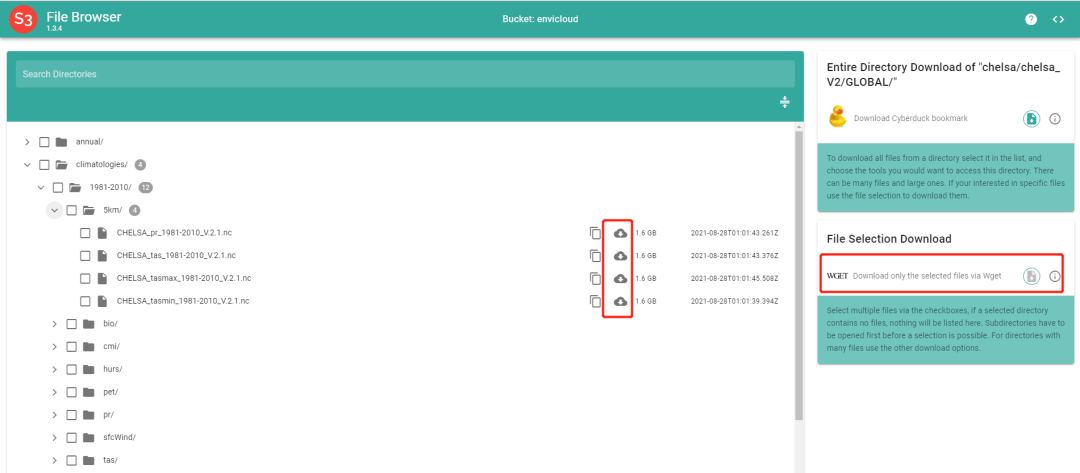 数据下载界面
- WGET的使用:wget批量下载遥感影像 (opens new window)
不过我看了一下给出的WGET链接,和NOAA的不一样,这个直接是数据下载地址
 WGET下载链接
这种情况下不用WGET其实也能下载。MOTRIX就可以,图形界面,比WGET写代码更适合普通用户。复制上面的链接,打开MOTIRX,下载就OK。
 把上面WGET链接直接沾到MOTRIX里面就行
# 数据介绍
# 数据命名
CHELSA数据遵循以下命名方式:
CHELSA_[short_name]_[timeperiod]_[Version].tif
- short_name用来区别文件类型
- timeperiod时间
- Version版本

下载的几个实验数据的名字
# 第一版和第二版数据的差别
- 从ERA-Interim转换为ERA5作为强制数据;
- 版本2使用基于ERA5再分析大气温度的950和850hPa压力水平的温度递减率,而不是估计整个大气的温度递减率。
- 版本2对围绕日期线的降水使用改进的偏差校正。降水也使用 (Beck et al. 2020) 对系统测量误差进行了偏差校正。
- 所有变量都保存为整数,并在geotiff文件中嵌入给定的偏移量和比例
# 已经发布的数据
下面是已经发布的数据列表,可以根据shot_name从下载地址查找所需的数据。
注意:
单位unit,scale尺度和偏移offset
- GDAL版本2.3及以上的软件可以自动读取偏移和尺度信息,如QGIS显示的就是真实结果
- 在ArcGIS中无法识别,下面的数据有尺度和偏移的要乘以尺度和加上偏移才是真实值。
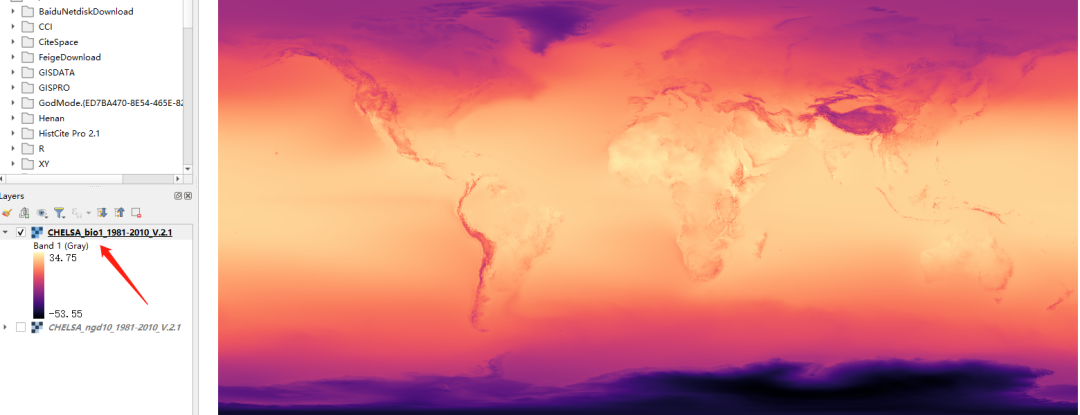 QGIS显示的是真实值,尺度转换和偏移后的
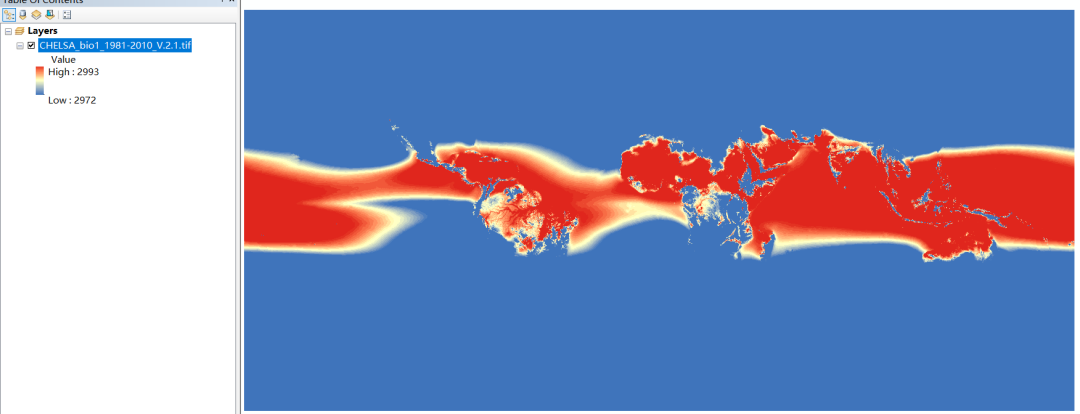 ArcGIS显示的结果未经尺度转换和偏移,需要自行转换后才可以得到真实值
| shortname | longname | unit | scale | offset | explanation |
|---|---|---|---|---|---|
| bio1 | mean annual air temperature | °C | 0.1 | -273.15 | mean annual daily mean air temperatures averaged over 1 year |
| bio2 | mean diurnal air temperature range | °C | 0.1 | 0 | mean diurnal range of temperatures averaged over 1 year |
| bio3 | isothermality | °C | 0.1 | 0 | ratio of diurnal variation to annual variation in temperatures |
| bio4 | temperature seasonality | °C | 0.1 | 0 | standard deviation of the monthly mean temperatures |
| bio5 | mean daily maximum air temperature of the warmest month | °C | 0.1 | -273.15 | The highest temperature of any monthly daily mean maximum temperature |
| bio6 | mean daily minimum air temperature of the coldest month | °C | 0.1 | -273.15 | The lowest temperature of any monthly daily mean maximum temperature |
| bio7 | annual range of air temperature | °C | 0.1 | 0 | The difference between the Maximum Temperature of Warmest month and the Minimum Temperature of Coldest month |
| bio8 | mean daily mean air temperatures of the wettest quarter | °C | 0.1 | -273.15 | The wettest quarter of the year is determined (to the nearest month) |
| bio9 | mean daily mean air temperatures of the driest quarter | °C | 0.1 | -273.15 | The driest quarter of the year is determined (to the nearest month) |
| bio10 | mean daily mean air temperatures of the warmest quarter | °C | 0.1 | -273.15 | The warmest quarter of the year is determined (to the nearest month) |
| bio11 | mean daily mean air temperatures of the coldest quarter | °C | 0.1 | -273.15 | The coldest quarter of the year is determined (to the nearest month) |
| bio12 | annual precipitation amount | kg m-2 | 0.1 | 0 | Accumulated precipitation amount over 1 year |
| bio13 | precipitation amount of the wettest month | kg m-2 | 0.1 | 0 | The precipitation of the wettest month. |
| bio14 | precipitation amount of the driest month | kg m-2 | 0.1 | 0 | The precipitation of the driest month. |
| bio15 | precipitation seasonality | kg m-2 | 0.1 | 0 | The Coefficient of Variation is the standard deviation of the monthly precipitation estimates expressed as a percentage of the mean of those estimates (i.e. the annual mean) |
| bio16 | mean monthly precipitation amount of the wettest quarter | kg m-2 | 0.1 | 0 | The wettest quarter of the year is determined (to the nearest month) |
| bio17 | mean monthly precipitation amount of the driest quarter | kg m-2 | 0.1 | 0 | The driest quarter of the year is determined (to the nearest month) |
| bio18 | mean monthly precipitation amount of the warmest quarter | kg m-2 | 0.1 | 0 | The warmest quarter of the year is determined (to the nearest month) |
| bio19 | mean monthly precipitation amount of the coldest quarter | kg m-2 | 0.1 | 0 | The coldest quarter of the year is determined (to the nearest month) |
| gdgfgd0 | First growing degree day above 0°C | julian day | – | – | First day of the year above 0°C |
| gdgfgd5 | First growing degree day above 5°C | julian day | – | – | First day of the year above 5°C |
| gdgfgd10 | First growing degree day above 10°C | julian day | – | – | First day of the year above 10°C |
| fcf | Frost change frequency | count | – | – | Number of events in which tmin or tmax go above, or below 0°C |
| gdd0 | Growing degree days heat sum above 0°C | °C | 0.1 | 0 | heat sum of all days above the 0°C temperature accumulated over 1 year. |
| gdd5 | Growing degree days heat sum above 5°C | °C | 0.1 | 0 | heat sum of all days above the 5°C temperature accumulated over 1 year. |
| gdd10 | Growing degree days heat sum above 10°C | °C | 0.1 | 0 | heat sum of all days above the 10°C temperature accumulated over 1 year. |
| gddlgd0 | Last growing degree day above 0°C | julian day | – | – | Last day of the year above 0°C |
| gddlgd5 | Last growing degree day above 5°C | julian day | – | – | Last day of the year above 5°C |
| gddlgd10 | Last growing degree day above 10°C | julian day | – | – | Last day of the year above 10°C |
| gsl | growing season length TREELIM | number of days | – | – | Length of the growing season |
| gsp | Accumulated precipiation amount on growing season days TREELIM | kg m-2 | 0.1 | 0 | precipitation sum accumulated on all days during the growing season based on TREELIM (https://doi.org/10.1007/s00035-014-0124-0) |
| gst | Mean temperature of the growing season TREELIM | °C | 0.1 | -273.15 | Mean temperature of all growing season days based on TREELIM (https://doi.org/10.1007/s00035-014-0124-0) |
| lgd | last day of the growing season TREELIM | julian day | – | – | Last day of the growing season according to TREELIM (https://doi.org/10.1007/s00035-014-0124-0) |
| fgd | first day of the growing season TREELIM | julian day | – | – | first day of the growing season according to TREELIM (https://doi.org/10.1007/s00035-014-0124-0) |
| ngd0 | Number of growing degree days | number of days | – | – | Number of days at which tas > 0°C |
| ngd5 | Number of growing degree days | number of days | – | – | Number of days at which tas > 5°C |
| ngd10 | Number of growing degree days | number of days | – | – | Number of days at which tas > 10°C |
| kg0 | Köppen-Geiger climate classification | category | – | – | Köppen Geiger Koeppen, W., Geiger, R. (1936): Handbuch der Klimatologie. Gebrüder Borntraeger, Berlin. Wikimedia. |
| kg1 | Köppen-Geiger climate classification | category | – | – | Köppen Geiger without As/Aw differentiation Koeppen, W., Geiger, R. (1936): Handbuch der Klimatologie. Gebrüder Borntraeger, Berlin. Wikimedia. |
| kg2 | Köppen-Geiger climate classification | category | – | – | Köppen Geiger after Peel et al. 2007 Peel, M. C., Finlayson, B. L., McMahon, T. A. (2007): Updated world map of the Koeppen-Geiger climate classification. Hydrology and earth system sciences discussions, 4(2), 439-473. Free Access. |
| kg3 | Köppen-Geiger climate classification | category | – | – | Wissmann 1939 Wissmann, H. (1939): Die Klima-und Vegetationsgebiete Eurasiens: Begleitworte zu einer Karte der Klimagebiete Eurasiens. Z. Ges. Erdk. Berlin, p.81-92. |
| kg4 | Köppen-Geiger climate classification | category | – | – | Thornthwaite 1931 Thornthwaite, C. W. (1931): The climates of North America: according to a new classification. Geographical review, 21(4), 633-655. JSTOR. |
| kg5 | Köppen-Geiger climate classification | category | – | – | Troll-Pfaffen Troll, C. & Paffen, K.H. (1964): Karte der Jahreszeitenklimate der Erde. Erdkunde 18, p5-28 Free Access. |
| scd | Snow cover days | count | – | – | Number of days with snowcover calculated using the snowpack model implementation in from TREELIM (https://doi.org/10.1007/s00035-014-0124-0) |
| swe | Snow water equivalent | kg m-2 | 0.1 | 0 | Amount of luquid water if snow is melted |
| npp | Net primary productivity | g C m−2 yr−1 | 0.1 | 0 | Calculated based on the ‘Miami model’, Lieth, H., 1972. “Modelling the primary productivity of the earth. Nature and resources”, UNESCO, VIII, 2:5-10. |
| pr | precipitation amount | kg m-2 | 0.1 | 0 | “Amount” means mass per unit area. “Precipitation” in the earth’s atmosphere means precipitation of water in all phases. |
| tasmax | mean daily maximum 2m air temperature | °C | 0.1 | -273.15 | daily maximum air temperatures at 2 metres from hourly ERA5 data |
| tas | mean daily air temperature | °C | 0.1 | -273.15 | daily mean air temperatures at 2 metres from hourly ERA5 data |
| tasmin | mean daily minimum air temperature | °C | 0.1 | -273.15 | daily minimum air temperatures at 2 metres from hourly ERA5 data |
# 参考文献
- https://chelsa-climate.org/
- https://envicloud.wsl.ch/#/?prefix=chelsa%2Fchelsa_V2%2FGLOBAL%2F
- 【工具分享】如何快速下载网络资源 (opens new window)
# 作者信息

有问题,我来改改 (opens new window)
上次更新: 2022/10/17, 19:07:36
